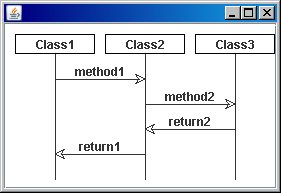
JGraphを使って、簡単なシーケンス図を描いてみました。
まず実行結果から。

見ての通りシーケンス図です。
Returnが点線じゃないとかのツッコミは置いといて。
では、簡単にソースを見ていきましょう。
今回は、BTraceで取ったログからシーケンス図を作成するという想定なので
中間モデルを定義して、そこからJGraphのクラスを作っていきます。
まずは、ノード(要するにクラス)を示すモデル。
public class Node {
	/** ノード名 */
	private String name;

	// setter/getterは省略
}
続いて、メソッドのIN/OUTの端点(コネクタの両端)のモデル
public class EndPoint {
	/** 所属するノード */
	private Node node;

	// setter/getterは省略
}
モデルの最後です。メソッド呼び出しを示す矢印のモデル
public class Connector {
	/** 結線の名称 */
	private String name;

	/** 開始端点 */
	private EndPoint from;

	/** 終了端点 */
	private EndPoint to;

	// setter/getterは省略
}
親から子を参照するのではなく、子から親を参照する形式なのは若干RDBMS中毒のような気もしますね。
まぁJGraph的に親から子を参照する方が良かったら、そう修正すれば良いかなぐらいで、
あんまり深くは考えていません。
続いて、このモデルからシーケンス図を描くクラス。今回のメインソースです。
import java.awt.Color;
import java.awt.geom.Rectangle2D;
import java.util.ArrayList;
import java.util.HashMap;
import java.util.List;
import java.util.Map;

import org.jgraph.JGraph;
import org.jgraph.graph.DefaultEdge;
import org.jgraph.graph.DefaultGraphCell;
import org.jgraph.graph.DefaultGraphModel;
import org.jgraph.graph.GraphConstants;
import org.jgraph.graph.GraphModel;

public class GraphCreator {
	/** ノードの幅 */
	private int nodeWidth = 80;

	/** ノードの高さ */
	private int nodeHeight = 20;

	/** ノードの間隔 */
	private int nodeInterval = 10;

	/** 結線の間隔 */
	private int edgeInterval = 25;

	/** 端点セルのマップ */
	private Map<EndPoint, DefaultGraphCell> endPointMap = new HashMap<EndPoint, DefaultGraphCell>();

	/** ノードセルのマップ */
	private Map<Node, DefaultGraphCell> nodeMap = new HashMap<Node, DefaultGraphCell>();

	/** 全オブジェクトのリスト */
	List<DefaultGraphCell> cellList = new ArrayList<DefaultGraphCell>();

	/** 結線の数 */
	private int edgeCount;

	/**
	 * コンストラクタ。モデルの変換を行います。
	 * @param connectorList 結線のリスト
	 */
	public GraphCreator(List<Connector> connectorList) {
		for (Connector connector : connectorList) {
			createConnectorCell(connector);
		}

		// 活性線の作成
		for (DefaultGraphCell nodeCell : this.nodeMap.values()) {
			DefaultGraphCell endCell = createEndPointCell(nodeCell);
			this.cellList.add(endCell);
			endCell.addPort();

			DefaultEdge edge = new DefaultEdge();
			edge.setSource(nodeCell.getChildAt(0));
			edge.setTarget(endCell.getChildAt(0));
			this.cellList.add(edge);
		}
	}

	/**
	 * グラフの描画を行います。
	 */
	public JGraph createGraph() {
		GraphModel model = new DefaultGraphModel();
		JGraph graph = new JGraph(model);
		graph.setJumpToDefaultPort(true);
		graph.getGraphLayoutCache().insert(this.cellList.toArray());

		return graph;
	}

	private void createConnectorCell(Connector connector) {
		EndPoint from = connector.getFrom();
		DefaultGraphCell fromCell = findEndPointCell(from);

		EndPoint to = connector.getTo();
		DefaultGraphCell toCell = findEndPointCell(to);

		DefaultEdge edge = new DefaultEdge(connector.getName());
		edge.setSource(fromCell.getChildAt(0));
		edge.setTarget(toCell.getChildAt(0));
		GraphConstants.setLineEnd(edge.getAttributes(),
				GraphConstants.ARROW_CLASSIC);
		GraphConstants.setLabelAlongEdge(edge.getAttributes(), true);

		this.cellList.add(edge);
		this.edgeCount++;
	}

	private DefaultGraphCell findEndPointCell(EndPoint endPoint) {
		DefaultGraphCell cell = this.endPointMap.get(endPoint);

		if (cell == null) {
			Node node = endPoint.getNode();
			DefaultGraphCell nodeCell = findNodeCell(node);
			cell = createEndPointCell(nodeCell);

			this.endPointMap.put(endPoint, cell);
			this.cellList.add(cell);
		}

		return cell;
	}

	private DefaultGraphCell createEndPointCell(DefaultGraphCell nodeCell) {
		DefaultGraphCell cell = new DefaultGraphCell();

		// X座標 = ノードの中央値
		Rectangle2D rectangle = (Rectangle2D) nodeCell.getAttributes().get(
				GraphConstants.BOUNDS);
		double x = rectangle.getCenterX();

		// Y座標 = 上端からの余白 + ノードの高さ + (結線の数 + 1) * 結線の間隔
		int y = this.nodeInterval + this.nodeHeight + (this.edgeCount + 1)
				* edgeInterval;

		GraphConstants.setBounds(cell.getAttributes(), new Rectangle2D.Double(
				x, y, 0, 0));
		cell.addPort();

		return cell;
	}

	private DefaultGraphCell findNodeCell(Node node) {
		DefaultGraphCell cell = this.nodeMap.get(node);

		if (cell == null) {
			cell = new DefaultGraphCell(node.getName());

			// X座標 = 左端からの余白 + ノード数 * (ノード幅 + ノード間隔)
			int x = this.nodeInterval + this.nodeMap.size()
					* (this.nodeWidth + this.nodeInterval);

			// Y座標 = 上端からの余白
			int y = this.nodeInterval;

			GraphConstants.setBounds(cell.getAttributes(),
					new Rectangle2D.Double(x, y, nodeWidth, nodeHeight));
			GraphConstants.setBorderColor(cell.getAttributes(), Color.black);

			this.nodeMap.put(node, cell);
			this.cellList.add(cell);
			cell.addPort();
		}

		return cell;
	}
}
JGraphの使い方をあまりよく理解しようとしてないので、親子関係とかは適当です。
とにかく、シーケンス図さえ描ければ良いと思ってゴリゴリ書きました。
さて、最後に、上のGraphCreatorクラスを利用するサンプルクラスです。
import java.util.ArrayList;
import java.util.List;

import javax.swing.JFrame;
import javax.swing.JScrollPane;

import org.jgraph.JGraph;

public class Sample {
	public static void main(String[] args) {
		Node node1 = new Node();
		node1.setName("Class1");

		Node node2 = new Node();
		node2.setName("Class2");

		Node node3 = new Node();
		node3.setName("Class3");

		Connector connector1 = new Connector();
		connector1.setName("method1");

		EndPoint endPoint1From = new EndPoint();
		endPoint1From.setParentNode(node1);

		EndPoint endPoint1To = new EndPoint();
		endPoint1To.setParentNode(node2);

		connector1.setFrom(endPoint1From);
		connector1.setTo(endPoint1To);

		Connector connector2 = new Connector();
		connector2.setName("method2");

		EndPoint endPoint2From = new EndPoint();
		endPoint2From.setParentNode(node2);

		EndPoint endPoint2To = new EndPoint();
		endPoint2To.setParentNode(node3);

		connector2.setFrom(endPoint2From);
		connector2.setTo(endPoint2To);

		Connector connector3 = new Connector();
		connector3.setName("return2");

		EndPoint endPoint3From = new EndPoint();
		endPoint3From.setParentNode(node3);

		EndPoint endPoint3To = new EndPoint();
		endPoint3To.setParentNode(node2);

		connector3.setFrom(endPoint3From);
		connector3.setTo(endPoint3To);

		Connector connector4 = new Connector();
		connector4.setName("return1");

		EndPoint endPoint4From = new EndPoint();
		endPoint4From.setParentNode(node2);

		EndPoint endPoint4To = new EndPoint();
		endPoint4To.setParentNode(node1);

		connector4.setFrom(endPoint4From);
		connector4.setTo(endPoint4To);

		List<Connector> connectorList = new ArrayList<Connector>();
		connectorList.add(connector1);
		connectorList.add(connector2);
		connectorList.add(connector3);
		connectorList.add(connector4);

		GraphCreator graphCreator = new GraphCreator(connectorList);
		JGraph graph = graphCreator.createGraph();

		JFrame frame = new JFrame();
		frame.getContentPane().add(new JScrollPane(graph));
		frame.setDefaultCloseOperation(JFrame.EXIT_ON_CLOSE);
		frame.pack();
		frame.setVisible(true);
	}
}
特にボリュームも大きくなく、難しいところもありません。
これぐらい簡単なソースでシーケンス図が描けたのは、まさにJGraphのおかげですね。